

This piece is a bit long and may seem disjointed, but only because we are so used to pat, over-simplified, one-sided answers for everything when reality is incredibly messy and wonderfully complex.
I have a problem with the current issue of climate change. The problem is due PARTLY to the following:
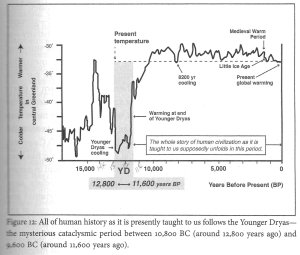 Are we to blame for the dramatic cooling and heating over the millennia in which average temperatures rose and fell as much as 8-15 degrees Centigrade? I hardly think so! Were whole civilizations lost? Yes, absolutely. Were humans totally wiped out by these temperature changes? Obviously not.
As for #2 and the charge of fiddling with climate data, when I was working with Dr. Levengood in the lab for fifteen years, he mentioned more than once that he and fellow scientists had been completely banned from talking or writing about what was really going on with meteorology, weather, or climate science. Even emails were forbidden. Recently, 300 scientists and academics requested that Congress investigate NOAA for “cooking the books” when it came to raw data on climate change (NSNBC International, 1/30/2016).
Counter-complaints say that the Congressman who accepted the scientists’ request for an investigation is being funded by gas and oil companies who are denying climate change. Duh! The scientists are not going to submit their request to someone who is pushing the current climate change theories. Let's be real about how our system works! (More on the connection between industry and climate in a minute.) Anyway, this is not the first time scientists have complained that the raw data is being altered to show climate warming when it has actually stopped warming and begun to cool a little.
#3. Right around January 16th or 17th, I happened to see a photo of the sky, a silver craft, and some clouds taken by someone in Missouri. The guy who took the photo was excitedly proclaiming that it was a UFO, that it was sitting silently over his back yard, and that we now had proof of aliens. I took one look at the signature cloud formation and thought, “Nope! That’s a weather craft…and it’s fiddling with your weather, my friend. You’re probably going to have a deluge in a few days.” Over the next couple of days, I kept an eye on the weather over Missouri. Sure enough…winter storm Jonas appeared within a couple of days and traveled across the midline of the U.S., burying the East Coast under as much as 40 inches of snow.
If you have not been to the website What Is In Our Skies, https://www.youtube.com/watch?v=wVqKe_iV2EI, you need to educate yourself now. This is a 19-part YouTube series that is excellent. The parts range from 6 or 7 minutes, up to 14 minutes, and down to 2 minutes in length. At least watch the first ten parts. Then watch it again until you can recognize the weather craft currently being used to mess with our climate in every corner of the U.S. The technology is not just amazing, it’s stunning!!
#4. If coal, oil, and gas industries are to blame for climate warming, all we have to do is stop coal, oil, and gas. But how can we stop coal, oil, and gas when they are the very things that make it possible for us to be warm in winter, cool in summer, or go to visit our family in other parts of the country or the world? How do we continue to produce pots and pans, telephones and computers, 600-thread-count sheets for our beds, and other things that characterize life in these times?
Can we move in the direction of replacing coal, oil, and gas (and nuclear) with renewable energy? Yes, of course, and we are definitely moving that way. Things take time. Some groups of people are way ahead of us, for example, Germany and Iceland. However, keeping a steady pressure on is necessary because people who are comfortable with the present industries will have considerable inertia and resist change, even though it is good for them...and yes, I’m including the 1% here. They need time to change just like we do. We are all in this together.
As for #5… I do not know from whom, what, or where comes the accusation of “human-caused climate change.” I see the phrase here and there, sprinkled liberally in arguments pro and con, but the origination of this idea seems to hide in some murky place that I cannot identify. So…let’s start with a question that makes sense: When we cut down billions of trees, who or what is left to absorb the CO2?
Answer – The ocean!
When the ocean is saturated, CO2 begins to accumulate in the air. If we are adding to the problem by cutting down more trees and burning more fossil fuels, that’s our stupidity, but rising CO2 is not the basic driver of climate change. I have said before that I don’t know of anything more arrogant than the idea that humans are responsible for planetary warming and climate change. If this were true, how do we explain the warming now taking place on Mars, Venus, Jupiter, and the other planets in the solar system? We do NOT always have to make somebody guilty of something, and this blame game takes our focus off of the ability to perceive what is really going on and come up with solutions that make sense. It doesn't matter who's to blame, it matters whether we do something about the problem or not.
There is no single, simple explanation for what is being touted as climate change. Reality is far too complex for that! I read recently – again – that carbon dioxide (CO2) was the driver of climate change. This is not true. Serious rises in CO2 are the result of environmental degradation. These may contribute to climate change already in progress, but there are planetary factors operating that we know nothing about. Take the solar system and what we know about its life cycle, add Mother Earth’s natural cycles of warming and cooling, throw in the sophisticated technologies developed and used by SOMEONE to change the weather, add serious environmental destruction, and all you can legitimately say is that “Change happens. Better stay flexible.”
Are we to blame for the dramatic cooling and heating over the millennia in which average temperatures rose and fell as much as 8-15 degrees Centigrade? I hardly think so! Were whole civilizations lost? Yes, absolutely. Were humans totally wiped out by these temperature changes? Obviously not.
As for #2 and the charge of fiddling with climate data, when I was working with Dr. Levengood in the lab for fifteen years, he mentioned more than once that he and fellow scientists had been completely banned from talking or writing about what was really going on with meteorology, weather, or climate science. Even emails were forbidden. Recently, 300 scientists and academics requested that Congress investigate NOAA for “cooking the books” when it came to raw data on climate change (NSNBC International, 1/30/2016).
Counter-complaints say that the Congressman who accepted the scientists’ request for an investigation is being funded by gas and oil companies who are denying climate change. Duh! The scientists are not going to submit their request to someone who is pushing the current climate change theories. Let's be real about how our system works! (More on the connection between industry and climate in a minute.) Anyway, this is not the first time scientists have complained that the raw data is being altered to show climate warming when it has actually stopped warming and begun to cool a little.
#3. Right around January 16th or 17th, I happened to see a photo of the sky, a silver craft, and some clouds taken by someone in Missouri. The guy who took the photo was excitedly proclaiming that it was a UFO, that it was sitting silently over his back yard, and that we now had proof of aliens. I took one look at the signature cloud formation and thought, “Nope! That’s a weather craft…and it’s fiddling with your weather, my friend. You’re probably going to have a deluge in a few days.” Over the next couple of days, I kept an eye on the weather over Missouri. Sure enough…winter storm Jonas appeared within a couple of days and traveled across the midline of the U.S., burying the East Coast under as much as 40 inches of snow.
If you have not been to the website What Is In Our Skies, https://www.youtube.com/watch?v=wVqKe_iV2EI, you need to educate yourself now. This is a 19-part YouTube series that is excellent. The parts range from 6 or 7 minutes, up to 14 minutes, and down to 2 minutes in length. At least watch the first ten parts. Then watch it again until you can recognize the weather craft currently being used to mess with our climate in every corner of the U.S. The technology is not just amazing, it’s stunning!!
#4. If coal, oil, and gas industries are to blame for climate warming, all we have to do is stop coal, oil, and gas. But how can we stop coal, oil, and gas when they are the very things that make it possible for us to be warm in winter, cool in summer, or go to visit our family in other parts of the country or the world? How do we continue to produce pots and pans, telephones and computers, 600-thread-count sheets for our beds, and other things that characterize life in these times?
Can we move in the direction of replacing coal, oil, and gas (and nuclear) with renewable energy? Yes, of course, and we are definitely moving that way. Things take time. Some groups of people are way ahead of us, for example, Germany and Iceland. However, keeping a steady pressure on is necessary because people who are comfortable with the present industries will have considerable inertia and resist change, even though it is good for them...and yes, I’m including the 1% here. They need time to change just like we do. We are all in this together.
As for #5… I do not know from whom, what, or where comes the accusation of “human-caused climate change.” I see the phrase here and there, sprinkled liberally in arguments pro and con, but the origination of this idea seems to hide in some murky place that I cannot identify. So…let’s start with a question that makes sense: When we cut down billions of trees, who or what is left to absorb the CO2?
Answer – The ocean!
When the ocean is saturated, CO2 begins to accumulate in the air. If we are adding to the problem by cutting down more trees and burning more fossil fuels, that’s our stupidity, but rising CO2 is not the basic driver of climate change. I have said before that I don’t know of anything more arrogant than the idea that humans are responsible for planetary warming and climate change. If this were true, how do we explain the warming now taking place on Mars, Venus, Jupiter, and the other planets in the solar system? We do NOT always have to make somebody guilty of something, and this blame game takes our focus off of the ability to perceive what is really going on and come up with solutions that make sense. It doesn't matter who's to blame, it matters whether we do something about the problem or not.
There is no single, simple explanation for what is being touted as climate change. Reality is far too complex for that! I read recently – again – that carbon dioxide (CO2) was the driver of climate change. This is not true. Serious rises in CO2 are the result of environmental degradation. These may contribute to climate change already in progress, but there are planetary factors operating that we know nothing about. Take the solar system and what we know about its life cycle, add Mother Earth’s natural cycles of warming and cooling, throw in the sophisticated technologies developed and used by SOMEONE to change the weather, add serious environmental destruction, and all you can legitimately say is that “Change happens. Better stay flexible.”
- the facts point to climate cooling,
- the evidence that raw data is being altered to support the claim of “climate warming”
- the existence and use of sophisticated “weather craft,”
- the hopelessly tangled relationship between industry and governance,
- the naïve and simplistic habits of blame that people of earth have fallen into.
 Are we to blame for the dramatic cooling and heating over the millennia in which average temperatures rose and fell as much as 8-15 degrees Centigrade? I hardly think so! Were whole civilizations lost? Yes, absolutely. Were humans totally wiped out by these temperature changes? Obviously not.
As for #2 and the charge of fiddling with climate data, when I was working with Dr. Levengood in the lab for fifteen years, he mentioned more than once that he and fellow scientists had been completely banned from talking or writing about what was really going on with meteorology, weather, or climate science. Even emails were forbidden. Recently, 300 scientists and academics requested that Congress investigate NOAA for “cooking the books” when it came to raw data on climate change (NSNBC International, 1/30/2016).
Counter-complaints say that the Congressman who accepted the scientists’ request for an investigation is being funded by gas and oil companies who are denying climate change. Duh! The scientists are not going to submit their request to someone who is pushing the current climate change theories. Let's be real about how our system works! (More on the connection between industry and climate in a minute.) Anyway, this is not the first time scientists have complained that the raw data is being altered to show climate warming when it has actually stopped warming and begun to cool a little.
#3. Right around January 16th or 17th, I happened to see a photo of the sky, a silver craft, and some clouds taken by someone in Missouri. The guy who took the photo was excitedly proclaiming that it was a UFO, that it was sitting silently over his back yard, and that we now had proof of aliens. I took one look at the signature cloud formation and thought, “Nope! That’s a weather craft…and it’s fiddling with your weather, my friend. You’re probably going to have a deluge in a few days.” Over the next couple of days, I kept an eye on the weather over Missouri. Sure enough…winter storm Jonas appeared within a couple of days and traveled across the midline of the U.S., burying the East Coast under as much as 40 inches of snow.
If you have not been to the website What Is In Our Skies, https://www.youtube.com/watch?v=wVqKe_iV2EI, you need to educate yourself now. This is a 19-part YouTube series that is excellent. The parts range from 6 or 7 minutes, up to 14 minutes, and down to 2 minutes in length. At least watch the first ten parts. Then watch it again until you can recognize the weather craft currently being used to mess with our climate in every corner of the U.S. The technology is not just amazing, it’s stunning!!
#4. If coal, oil, and gas industries are to blame for climate warming, all we have to do is stop coal, oil, and gas. But how can we stop coal, oil, and gas when they are the very things that make it possible for us to be warm in winter, cool in summer, or go to visit our family in other parts of the country or the world? How do we continue to produce pots and pans, telephones and computers, 600-thread-count sheets for our beds, and other things that characterize life in these times?
Can we move in the direction of replacing coal, oil, and gas (and nuclear) with renewable energy? Yes, of course, and we are definitely moving that way. Things take time. Some groups of people are way ahead of us, for example, Germany and Iceland. However, keeping a steady pressure on is necessary because people who are comfortable with the present industries will have considerable inertia and resist change, even though it is good for them...and yes, I’m including the 1% here. They need time to change just like we do. We are all in this together.
As for #5… I do not know from whom, what, or where comes the accusation of “human-caused climate change.” I see the phrase here and there, sprinkled liberally in arguments pro and con, but the origination of this idea seems to hide in some murky place that I cannot identify. So…let’s start with a question that makes sense: When we cut down billions of trees, who or what is left to absorb the CO2?
Answer – The ocean!
When the ocean is saturated, CO2 begins to accumulate in the air. If we are adding to the problem by cutting down more trees and burning more fossil fuels, that’s our stupidity, but rising CO2 is not the basic driver of climate change. I have said before that I don’t know of anything more arrogant than the idea that humans are responsible for planetary warming and climate change. If this were true, how do we explain the warming now taking place on Mars, Venus, Jupiter, and the other planets in the solar system? We do NOT always have to make somebody guilty of something, and this blame game takes our focus off of the ability to perceive what is really going on and come up with solutions that make sense. It doesn't matter who's to blame, it matters whether we do something about the problem or not.
There is no single, simple explanation for what is being touted as climate change. Reality is far too complex for that! I read recently – again – that carbon dioxide (CO2) was the driver of climate change. This is not true. Serious rises in CO2 are the result of environmental degradation. These may contribute to climate change already in progress, but there are planetary factors operating that we know nothing about. Take the solar system and what we know about its life cycle, add Mother Earth’s natural cycles of warming and cooling, throw in the sophisticated technologies developed and used by SOMEONE to change the weather, add serious environmental destruction, and all you can legitimately say is that “Change happens. Better stay flexible.”
Are we to blame for the dramatic cooling and heating over the millennia in which average temperatures rose and fell as much as 8-15 degrees Centigrade? I hardly think so! Were whole civilizations lost? Yes, absolutely. Were humans totally wiped out by these temperature changes? Obviously not.
As for #2 and the charge of fiddling with climate data, when I was working with Dr. Levengood in the lab for fifteen years, he mentioned more than once that he and fellow scientists had been completely banned from talking or writing about what was really going on with meteorology, weather, or climate science. Even emails were forbidden. Recently, 300 scientists and academics requested that Congress investigate NOAA for “cooking the books” when it came to raw data on climate change (NSNBC International, 1/30/2016).
Counter-complaints say that the Congressman who accepted the scientists’ request for an investigation is being funded by gas and oil companies who are denying climate change. Duh! The scientists are not going to submit their request to someone who is pushing the current climate change theories. Let's be real about how our system works! (More on the connection between industry and climate in a minute.) Anyway, this is not the first time scientists have complained that the raw data is being altered to show climate warming when it has actually stopped warming and begun to cool a little.
#3. Right around January 16th or 17th, I happened to see a photo of the sky, a silver craft, and some clouds taken by someone in Missouri. The guy who took the photo was excitedly proclaiming that it was a UFO, that it was sitting silently over his back yard, and that we now had proof of aliens. I took one look at the signature cloud formation and thought, “Nope! That’s a weather craft…and it’s fiddling with your weather, my friend. You’re probably going to have a deluge in a few days.” Over the next couple of days, I kept an eye on the weather over Missouri. Sure enough…winter storm Jonas appeared within a couple of days and traveled across the midline of the U.S., burying the East Coast under as much as 40 inches of snow.
If you have not been to the website What Is In Our Skies, https://www.youtube.com/watch?v=wVqKe_iV2EI, you need to educate yourself now. This is a 19-part YouTube series that is excellent. The parts range from 6 or 7 minutes, up to 14 minutes, and down to 2 minutes in length. At least watch the first ten parts. Then watch it again until you can recognize the weather craft currently being used to mess with our climate in every corner of the U.S. The technology is not just amazing, it’s stunning!!
#4. If coal, oil, and gas industries are to blame for climate warming, all we have to do is stop coal, oil, and gas. But how can we stop coal, oil, and gas when they are the very things that make it possible for us to be warm in winter, cool in summer, or go to visit our family in other parts of the country or the world? How do we continue to produce pots and pans, telephones and computers, 600-thread-count sheets for our beds, and other things that characterize life in these times?
Can we move in the direction of replacing coal, oil, and gas (and nuclear) with renewable energy? Yes, of course, and we are definitely moving that way. Things take time. Some groups of people are way ahead of us, for example, Germany and Iceland. However, keeping a steady pressure on is necessary because people who are comfortable with the present industries will have considerable inertia and resist change, even though it is good for them...and yes, I’m including the 1% here. They need time to change just like we do. We are all in this together.
As for #5… I do not know from whom, what, or where comes the accusation of “human-caused climate change.” I see the phrase here and there, sprinkled liberally in arguments pro and con, but the origination of this idea seems to hide in some murky place that I cannot identify. So…let’s start with a question that makes sense: When we cut down billions of trees, who or what is left to absorb the CO2?
Answer – The ocean!
When the ocean is saturated, CO2 begins to accumulate in the air. If we are adding to the problem by cutting down more trees and burning more fossil fuels, that’s our stupidity, but rising CO2 is not the basic driver of climate change. I have said before that I don’t know of anything more arrogant than the idea that humans are responsible for planetary warming and climate change. If this were true, how do we explain the warming now taking place on Mars, Venus, Jupiter, and the other planets in the solar system? We do NOT always have to make somebody guilty of something, and this blame game takes our focus off of the ability to perceive what is really going on and come up with solutions that make sense. It doesn't matter who's to blame, it matters whether we do something about the problem or not.
There is no single, simple explanation for what is being touted as climate change. Reality is far too complex for that! I read recently – again – that carbon dioxide (CO2) was the driver of climate change. This is not true. Serious rises in CO2 are the result of environmental degradation. These may contribute to climate change already in progress, but there are planetary factors operating that we know nothing about. Take the solar system and what we know about its life cycle, add Mother Earth’s natural cycles of warming and cooling, throw in the sophisticated technologies developed and used by SOMEONE to change the weather, add serious environmental destruction, and all you can legitimately say is that “Change happens. Better stay flexible.”
Comments
Lee Barrett
Come on Penny. Pretty one-side article. As you previously acknowledged in your HAARP article your are “not well-versed in the finer points of the climate change argument.” Information about the dramatic increases in CO2 accumulation in the atmosphere over the past 4 decades is well documented (see below) and human contribution is not a matter of “arrogance” but rather based on the fact that human population, which took over 100,000 years to reach 1 billion (around 1800), doubled in the next 150 years to over 2 billion, and then tripled in the last 50 years to over 7.4 billion, which combined with the impacts of the industrial revolution resulted in exponential growth in energy consumption and in human generated CO2 emissions, especially over the past 4-5 decades.
I love your work and your writings, and, given your background as an engineer, I thought you might want to be more aware of the data above and below.
Lee Barrett
REPORT: 2007 Carbon Trends: An annual update of the global carbon budget and trends
Contributors — Highlights
Authors: Corinne Le Quéré [C.Lequere@uea.ac.uk], Mike Raupach ](CSIRO, Australia), Philippe Ciais (Commissariat a L’Energie Atomique, France), Thomas Conway (USA), Chris Field (Carnegie Instituton of Washington, USA), Skee Houghton (Woods Hole Research Center, USA), et al
Atmospheric CO2 growth
Annual mean growth rate of atmospheric CO2 was 2.2 ppm per year in 2007 (up from 1.8 ppm in 2006), and above the 2.0 ppm average for the period 2000-2007. The average annual mean growth rate for the previous 20 years was about 1.5 ppm per year. This increase brought the atmospheric CO2 concentration to 383 ppm in 2007, 37% above the concentration at the start of the industrial revolution (about 280 ppm in 1750). The present concentration is the highest during the last 650,000 years and probably during the last 20 million years. [ppm = parts per million].
Emissions from land use change
Land use change was responsible for estimated net emissions of 1.5 PgC per year to the atmosphere. This is largely the difference between CO2 emissions from deforestation and CO2 uptake by reforestation. Emissions for 2006 and 2007 were extrapolated from the previous 25-year trend of 1.5 PgC per year. Land use change emissions come almost exclusively from deforestation in tropical countries with an estimated 41% from South and Central America, 43% from South and Southeast Asia, and 17% from Africa. An estimated 160 PgC were emitted to the atmosphere from land use change during the period 1850-2007 [1 Pg = 1 billion tons or 1000 x million tons].
Emissions from fossil fuel and cement
Emissions increased from 6.2 PgC per year in 1990 to 8.5 PgC in 2007, a 38% increase from the Kyoto reference year 1990. The growth rate of emissions was 3.5% per year for the period of 2000-2007, an almost four fold increase from 0.9% per year in 1990-1999. The actual emissions growth rate for 2000-2007 exceeded the highest forecast growth rates for the decade 2000-2010.
Regional fossil fuel emissions
The biggest increase in emissions has taken place in developing countries, largely in China and India, while developed countries have been growing slowly. The largest regional shift was that China passed the U.S. in 2006 to become the largest CO2 emitter, and India will soon overtake Russia to become the third largest emitter. Currently, more than half of the global emissions come from less developed countries.
CO2 removal by natural sinks
Natural land and ocean CO2 sinks have removed 54% (or 4.8 PgC per year) of all CO2 emitted from human activities during the period 2000-2007. The size of the natural sinks has grown in proportion to increasing atmospheric CO2. However, the efficiency of these sinks in removing CO2 has decreased by 5% over the last 50 years, and will continue to do so in the future. That is, 50 years ago, for every ton of CO2 emitted to the atmosphere, natural sinks removed 600 kg. Currently, the sinks are removing only 550 kg for every ton of CO2 emitted, and this amount is falling.
Natural Ocean CO2 sinks
The global oceanic CO2 sink removed 25% of all CO2 emissions for the period 2000-2007, equivalent to an average of 2.3 PgC per year. The size of the CO2 sink in 2007 was similar to that in the previous year but lower by 0.1 PgC compared to its expected increase from atmospheric CO2 growth. This was due to the presence of a La Nina event in the equatorial Pacific. The Southern Ocean CO2 sink was higher in 2007 compared to 2006, consistent with the relatively weak winds and the low Southern Annular Mode (a circumpolar pressure oscillation between Antarctica and southern mid-latitudes). An analysis of the long term trend of the ocean sink shows a slower growth than expected of the CO2 sink over the last 20 years.
Natural Land CO2 sinks
Terrestrial CO2 sinks removed 29% of all anthropogenic emissions for the period 2000-2007, equivalent to an average of 2.6 PgC per year. Terrestrial ecosystems removed 2.9 PgC in 2007, down from 3.6 Pg in 2006, largely showing the high year-to-year variability of the sink. An analysis of the long term trend of the terrestrial sink shows a growing size of the CO2 sink over the last 50 years.
Anthropogenic CO2 emissions have been growing about four times faster since 2000 than during the previous decade, and despite efforts to curb emissions in a number of countries which are signatories of the Kyoto Protocol. Emissions from the combustion of fossil fuel and land use change reached the mark of 10 billion tons of carbon in 2007. Natural CO2 sinks are growing, but more slowly than atmospheric CO2, which has been growing at 2 ppm per year since 2000. This is 33% faster than during the previous 20 years. All of these changes characterize a carbon cycle that is generating stronger climate forcing and sooner than expected.
________________________________________
Presentation (ppt, pdf)
Download a complete ppt presentation with an overview of the Carbon Budget 2007
(ppt, 3.3 Mb) (pdf, 1.5 Mb)
Additional emission figures (pdf 25Kb)
Data Sources
Atmospheric CO2 concentration (Pieter Tans and Thomas Conway, NOAA/ESRL), Fossil fuel emissions (Gregg Marland, T.A. Boden, R.J. Andres, and J. Gregg, CDIAC), Emissions from land use change (Richard A. Houghton, FAO ), Ocean sink (Corinne Le Quéré).
Data Files
Data files and a complete description of data sources and calculations is availablle from: http://lgmacweb.env.uea.ac.uk/lequere/co2/carbon_budget.htm .
________________________________________
References supporting this analysis
Canadell JG, Corinne Le Quéré, Michael R. Raupach, Christopher B. Field, Erik T. Buitehuis, Philippe Ciais, Thomas J. Conway, RA. Houghton, Gregg Marland (2007) Contributions to accelerating atmospheric CO2 growth from economic activity, carbon intensity, and efficiency of natural sinks (pdf, 1.4Mb). Proceedings of the National Academy of Science, 0702737104
Canadell JG, Raupach MR, Houghton RA (2008) Anthropogenic CO2 emissions in Africa. Biogeosciences (submitted).
Gregg JS, Andres RJ, Marland G (2008) China: Emissions pattern of the world leader in CO2 emissions from fossil fuel consumption and cement production. Geophysical Research Letters 35, L08806, doi:10.1029/2007GL032887.
Le Quéré C , Rödenbeck C, Buitenhuis ET, Conway TJ, Langensfelds R, Gomez A, Labuschangne C, Ramonet M, Nakazawa T, Metzl N, Gillett NP, Heimann M (2007) Saturations of the Southern Ocean CO2 sink due to recent climate change. Science 316, 5832: 1735-1738.
Raupach MR, G. Marland, P. Ciais, C. Quéré, J.G. Canadell, C.B. Field (2007) Global and regional drivers of accelerating CO2 emissions. Proceedings of the National Academy of Science 14: 10288-10293
Other Recent Analyses
Luyssaert S, E. -Detlef Schulze, Annett Borner, Alexander Knohl, Dominik Hessenmoller, Beverly E. Law, Philippe Ciais, John Grace (2008) Old-growth forests as global carbon sinks. Nature 455, September 2008| doi:10.1038/nature07276.
Ciais P, M. J. Schelhaas, S. Zaehle1, S. L. Piao, A. Cescatti, J. Liski, S. Luyssaert, G. Le-Maire, E.-D. Schulze, O. Bouriaud, A. Freibauer, R. Valentini, G. J. Nabuurs (2008) Carbon accumulation in European forests. Nature Geoscience 1: 425–429, doi:10.1038/ngeo233.
Compton J. Tucker, and Inez Y. Fung, Wolfgang Buermann, Benjamin R. Lintner, Charles D. Koven, Alon Angert, Jorge E. Pinzon (2007) The changing carbon cycle at Mauna Loa Observatory. Proceedings of the National Academy of Science 2007;104;4249-4254; originally published online. doi:10.1073/PNAS.0611224104.
Gurney KR, David Baker D, Rayner P, Denning S (2008) Interannual variations in continental-scale net carbon exchange and sensitivity to observing networks estimated from atmospheric CO2 inversions for the period 1980 to 2005. Global Biogeochemical Cycles 22, GB3025, doi:10.1029/2007GB003082.
Nevison CD, Natalie M. Mahowald,1,2 Scott C. Doney,3 Ivan D. Lima,3 Guido R. van der Werf,4 James T. Randerson,5 David F. Baker,3 Prasad Kasibhatla, Galen A. McKinley (2008) Contribution of ocean, fossil fuel, land biosphere, and biomass burning carbon fluxes to seasonal and interannual variability in atmospheric CO2 Global Biogeochemical Cycles 22, GB3008, doi:10.1029/2007GB003068.
Peters, W., A. Jacobson, C. Sweeney, A. Andrews, T.J., Conway, K.A., Masarie, J.B. Miller, L. Bruhwiler, G. Petron, A. Hirsch, D. Worthy, van der Werf G., Randerson J.T., Wennberg P., Krol M., Tans P.(2007) An atmospheric perspective on North American carbon dioxide exchange: CarbonTracker, Proceedings of the National Academy of Science 104: 18925-18930.
Piao S, Philippe Ciais, Pierre Friedlingstein, Philippe Peylin, Markus Reichstein, Sebastiaan Luyssaert, Hank Margolis, Jingyun Fang, Alan Barr, Anping Chen, Achim Grelle, David Y. Hollinger, Tuomas Laurila, Anders Lindroth, Andrew D. Richardson & Timo Vesala (2008) Net carbon dioxide losses of northern ecosystems in response to autumn warming Nature 451, 49-52, doi:10.1038/nature06444.
Raupach MR, Canadell JG, Le Quéré C (2008) Anthropogenic and biophysical contributions to increasing atmospheric CO2 growth rate and airborne fraction. Biogeosciences Discuss 5: 2867-2896.
Schuster U, Watson A (2007) A variable and decreasing sink for atmospheric CO2 in the North Atlantic. Journal of Geophysical Research 112, C11006, doi:10.1029/2006JC003941.
Stephens et al (2007) Weak Northern and Strong Tropical Land Carbon Uptake from Vertical Profiles of Atmospheric CO2. Science. 22 June 2007: 1732-1735 DOI: 10.1126/science.1137004.
Takahashi et al. (2008). Global sea.air CO2 flux based on climatological surface ocean pCO2, and seasonal biological and temperature effects. Deep. Sea Research, 49, 1411-1421.
Recent Synthesis
Canadell JG, Pataki D, Gifford R, Houghton RA, Lou Y, Raupach MR, Smith P, Steffen W (2007) Saturation of the terrestrial carbon sink. (pdf, 1Mb) In: Terrestrial Ecosystems in a Changing World, Canadell JG, Pataki D, Pitelka L (eds.), pp. 59-78. The IGBP Series. Springer-Verlag, Berlin Heidelberg, pp. 59-78.
Doney S, Schimel D (2007) Carbon and Climate System Coupling. Annual Review of Environment and Resources.
IPCC (2007) Chapter 7. WG1Fourth Assessment Report. Couplings Between Changes in the Climate System and Biogeochemistry (pdf, 3.12 Mb)
Heimann M, Reichstein M (2008) Terrestrial ecosystem carbon dynamics and climate feedbacks. Nature 45, January 2008|doi:10.1038/nature06591.
Houghton RA (2007) Balancing the global carbon budget. Annual Review of Earth and Planetary Sciences 35: 313-347
© GCP 2001-2008 | Global Carbon Project | info@globalcarbonproject.org
July 27, 2017
jeaninedeal
Oh Penny, I’m so glad you wrote about this! The 300 scientists and academics who requested Congress investigate NOAA for “cooking the books,” sounds eerily like what’s going on today in regards to safe levels of radio and microwave frequencies in our environment.
A few years back, I actually called local “Flight Standards” because the artificial clouds were unusually low that day, and my throat became scratchy and irritated when I walked outside. Flight Standards (in Grand Rapids) sent me on a wild goose chase; first to the EPA, then the FAA, who sent me back to Flight Standards with no answers, only a online brochure about climate change, weather manipulation, and making “clouds” using water vapor. I did call Flight Standards a second time, and the same younger man I spoke to earlier told me all he knew was that the aircrafts doing the spraying had “clearance,” and had also observed that they were making “clouds,” but didn’t know why the clouds would irritate my throat. I recently checked the brochure link and it’s “no longer available.”
Thank you, Penny, for addressing this “hot” topic!
July 27, 2017
Elana Freeland
Please read http://www.amazon.com/Chemtrails-HAARP…/dp/1936239930.
July 27, 2017
neckerisland1973
Simultaneously, in the beginning and the end of all things – “Reality is incredibly messy and wonderfully complex.” My heart starts pounding and my pulse increases the more I’m able to tie all the loose ends together – life’s inter-twinedness is an ever bigger ball of rubber bands :)
Enjoyed your bullet points, which sent me off exploring a couple avenues I haven’t kept up on, especially weathercraft. I wondered about Jonas too. Made my way through the YouTube series.
We had a couple hours yesterday (Sunday) of clear blue skies and normal clouds. It felt like I hadn’t seen that in years. It was amazing how whole and happy I felt underneath that sky, instead of the murky, frenetic sky that has become the new norm.
Thanks and Happy February. – Michelle
July 27, 2017
Penny Kelly
I feel the same way when the sun is shining and the skies are a beautiful blue.
July 27, 2017
Penny Kelly
This looks very interesting, Elana. I put it on my reading list. Thanks!
July 27, 2017
Penny Kelly
Lee,
Thanks for your fervent comments but I don’t buy the idea that climate change is solely or even mostly the result of rising CO2. Documenting dramatic increases in CO2 may prove that a condition of high CO2 exists, but says nothing about its link to or causation of climate change. Such a claim is human speculation.
It is obvious to me that climate change is cyclical and indigenous to all planetary systems. I don’t like the fact that government spent years hyping the idea of ‘planetary warming,’ blaming that on human activities, and then, when it became obvious that it was cooling, they quickly changed their terminology to ‘climate change’ and have used weather technology to create droughts, floods, and snow storms to drive home their point and create paranoia.
I know that CO2 has been increasing, and there is some basis for saying that CO2 increase can be blamed on ‘human activities.’ Certainly we are contributing, and I labeled this ongoing contribution as ‘stupid’ in my article. But even so, I don’t see an increase in CO2 as necessarily bad. An environment of rising CO2 makes an excellent environment for nurturing trees, plants, and vegetation. When we cut trees down by the billions, the rise in CO2 is part of Mother Earth’s mechanism for making sure the remaining vegetation is very well-nourished and has a more supportive environment than usual in order to encourage the new growth that replaces what was lost. Plants love a high carbon dioxide environment!
Your timelines of population numbers DO follow the ‘party line of history’ as taught generally, but what is taught generally is not accurate. The truth is that our entire population was nearly wiped out 3 times in the period between 13,000 BC and 9,600 BC. Evidence from ice cores, and geological samples around Pennsylvania and New Jersey show that there were both catastrophic floods and fires triggered by a number of comet pieces that hit the ice cap and just at the edge of it, instantly melting huge areas of ice here and in Europe, and burning up everything else. Huge numbers of people, animals, and plants were lost in the aftermath and CO2 would have risen spectacularly because of all the carbon released, but the smoke and ash created such a heavy screen for sunlight that temperatures dropped precipitously and we entered a 1,000+ year period of freezing called the Younger Dryas period. Population numbers have been up and down dramatically over the years, with evidence of highly developed civilizations back 400 million years ago. From a near wipe-out roughly 10,000 years ago, we have reached our current numbers.
I appreciate your comments and the time it took to assemble your thoughts and references!
July 27, 2017
Leave a comment
Also in Letters To Earth
Children are a Gift to Oneself
January 05, 2020 1 Comment
Continue reading
Money, Cryptos, Gold and a Space-based Civilization – Pt. 1
November 23, 2019 4 Comments
Continue reading
A Barry Sanders Moment...
October 29, 2019 2 Comments
A Barry Sanders Moment...
"...Barry Sanders was a little guy, only 5’8”, but he was fast, he was light on his feet, he was alert, and he was supremely flexible. It didn’t matter that the forces arrayed against him were huge, heavy, and coming from every direction, all of them ready to pile on. Each of us is a little guy compared to the forces we now face. I think it’s time to decide if you’re going to be around long enough to help build a new civilization.
Continue reading